Language of Graphs, The
Coronet
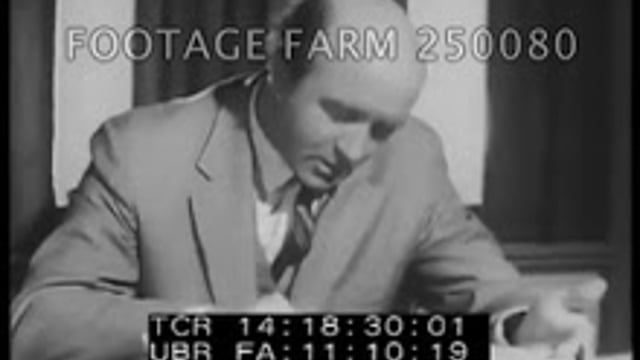
01:13:59 CU school newspaper; faculty advisor (narrator) in suit turning in swivel chair to blackboard as student writes deficit figure. Talks to others from behind desk (MOS) & hands raised to vote; students get up & leave.
01:14:40 SOF “Well now what? Bill & business manager talk, look at bar graph showing rising newsprint prices; decide to make a graph to show their problems. CUs. showing costs for five years. Advisor looks at the graph. SOF discussing.
01:17:03 Boys look in magazines & newspaper for line graph; CU showing shifts in Argentine economy w/ three lines: crops, livestock, manufacturing & mining.
01:17:32 Advisor leaving office shown graph comparing various school newspaper circulation. CU laying out axis; plotting four schools.
01:20:10 SOF Talking w/ editor about need to raise prices. CU circle graph (pie graph) showing income sources. Talk about it.
01:21:40 Formula graph explained using relationship between sales & number of papers sold. Animation.
01:23:52 SOF Boy at blackboard pointing to graphs & explaining what is needed to raise price to meet deficit. Summary w/ various graphs overlaying scenes of work, foreign countries, types of work using graphs.
01:26:01 Staff votes to increase price; talk about explaining to student body why it was necessary. Boys looking at newspaper, shake hands. The End.
Animated graphics; Junior High School; Educational Films; 1948; 1940s;


 Sign in with Google


 Similar Sub-themes

Language of Graphs, The Coronet 01:13:59 CU school newspaper; faculty advisor (narrator) in suit turning in swivel chair to blackboard as student writes deficit figure. Talks to others from behind desk (MOS) & hands raised to vote; students get up & leave. 01:14:40 SOF “Well now what? Bill & business manager talk, look at bar graph showing rising newsprint prices; decide to make a graph to show their problems. CUs. showing costs for five years. Advisor looks at the graph. SOF discussing. 01:17:03 Boys look in magazines & newspaper for line graph; CU showing shifts in Argentine economy w/ three lines: crops, livestock, manufacturing & mining. 01:17:32 Advisor leaving office shown graph comparing various school newspaper circulation. CU laying out axis; plotting four schools. 01:20:10 SOF Talking w/ editor about need to raise prices. CU circle graph (pie graph) showing income sources. Talk about it. 01:21:40 Formula graph explained using relationship between sales & number of papers sold. Animation. 01:23:52 SOF Boy at blackboard pointing to graphs & explaining what is needed to raise price to meet deficit. Summary w/ various graphs overlaying scenes of work, foreign countries, types of work using graphs. 01:26:01 Staff votes to increase price; talk about explaining to student body why it was necessary. Boys looking at newspaper, shake hands. The End. Animated graphics; Junior High School; Educational Films; 1948; 1940s;